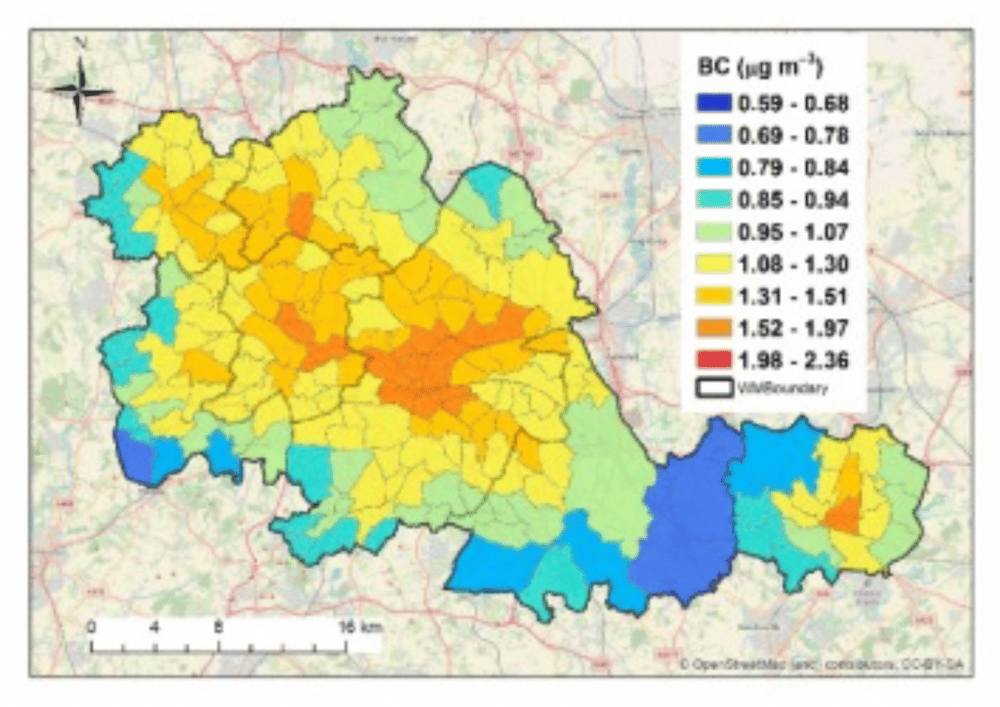
Black carbon—tiny, sooty particles from fuel combustion—is a major threat to both climate and health. In cities, traffic is one of the main sources. This study by Dr Jian Zhong and colleagues from the University of Birmingham used a detailed computer model (ADMS-Urban) to map black carbon concentrations across the West Midlands, including Birmingham and surrounding areas, at street-by-street resolution (10 m × 10 m).
By comparing model predictions with real-world measurements, the researchers found that traffic-related emissions had to be increased by about three times the official estimates to match what was observed at roadside monitoring stations. This suggests that existing traffic emission factors underestimate real conditions—possibly due to poorly maintained diesel filters or tampering. Even with these uncertainties, the model performed well and produced detailed maps showing the highest concentrations along busy roads such as the A38(M) and A41, and lower levels in suburban and rural areas.
The authors highlight that these high-resolution maps can inform local health studies and help design fairer air quality policies.
“Our results demonstrate the need to refine traffic emission factors and expand black carbon monitoring to better reflect urban exposure,” they wrote.
This work contributes to the WM-Air and WM-Net Zero projects, supporting regional planning toward cleaner, healthier, and more equitable cities.
Read the full paper here:
https://www.sciencedirect.com/science/article/pii/S0160412025000169